You must have heard lately in the news that the yield curve has inverted but were wondering what the heck is that!!! and what does it mean for my investments. In this blog i’ll try to explain inverted yield curve in simple language and it’s possible implications.
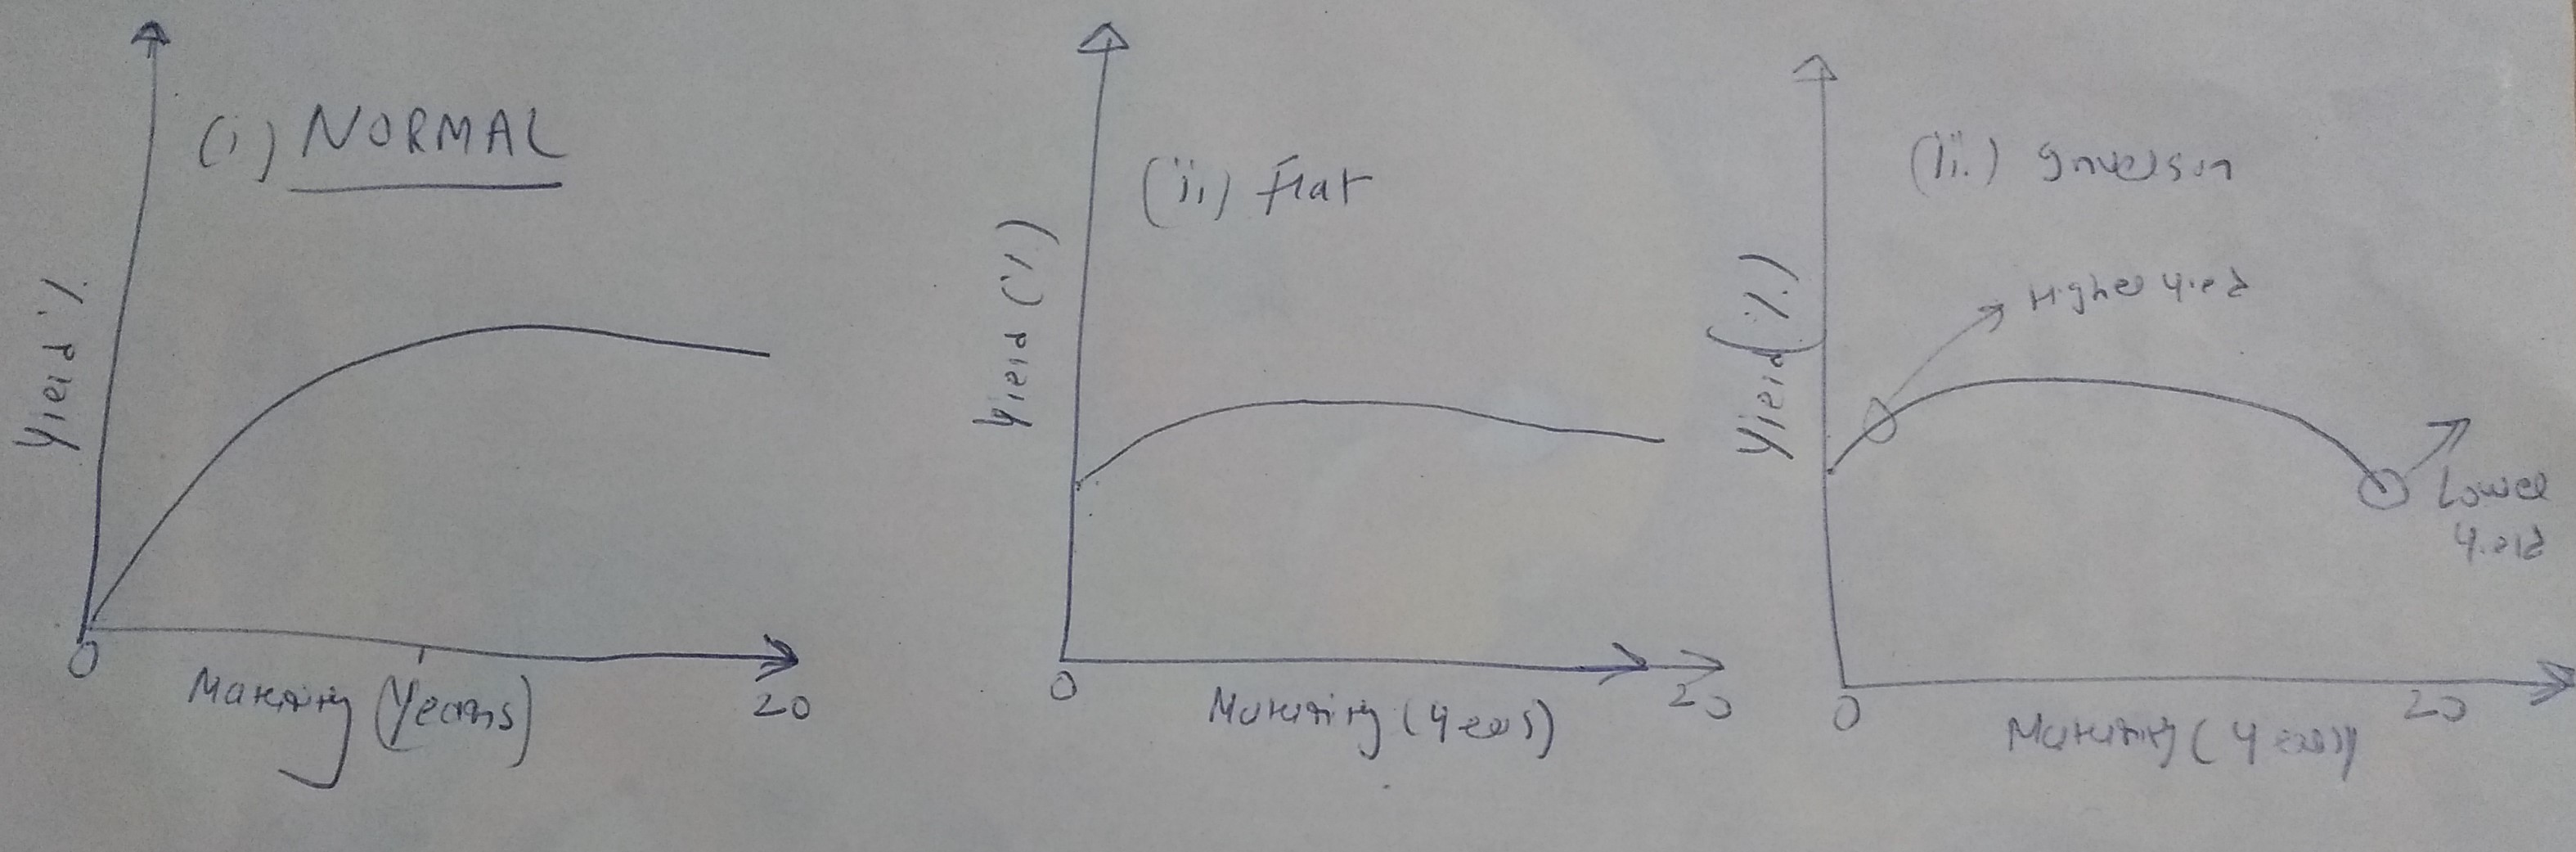
The horizontal axis in these curves represents maturity in years and vertical axis represents yields aka interest rates of bonds issued by US treasury. In normal case, short term interest rates are lower than long term interest rates which is natural but as the curve flattens short term interest rates are closer to the long term and eventually the long term rates become lower than short term and this phenomenon is known as yield curve inversion. Yield curve inversion is considered as a predictor for recession and it was fairly accurate in the past. The onset of recession is ~ 20 months after the curve inversion so recession might start some time in 2021. However, there has been lot of quantitative easing or economic stimulus in the recent past and i wonder if that might confound the predictive power of curve inversion. Only time will tell!!!
My plan: Start loading up whatever extra cash i can so once the recession hits i can buy Stocks, ETFs at a hugely discounted price. Keep doing dollar cost averaging aka Systematic investment plan and don’t sell stash early even if the prices goes to rock bottom. I know one might say that’s bad risk management but am thinking of long term. I’m certain there is serious money to be made if one buys during recession and hold for long enough provided recession doesn’t long this life time 🙂
Tip Jar
BTC: 38Y4ppVzd7H9kGo2rJsxzmrRHm9qkR1g3Q
BCH: pqkx0whq44xllx0n46w4vhetdkr238wczy85nd93dd
ETH: 0x47eFF672760968C02e84eEaF7c356e99DAcf4Cb1
LTC: LWyZxabRdFFCMtftJrmDwKdbS8G1rC4oxL
USDT: 3QYbMAVMVYj4uaMpD1ujms62n5zeeMjFVy

Good short explication 🙂
LikeLike